Vyom Earth
A 3D globe with satellite imagery, place names and roads. Search by village and district, a coordinate or a map link, and fly straight to the field.
Indiaat 0.5 m, Sentinel at 10 m
Vyom is an Earth-observation platform for agriculture. Outline a field with one tap, follow its season pass by pass, see it through monsoon cloud, and take all of it into your own research through an API.
Free while in testing · 25 analyses a day · sign in with an email code or a passkey
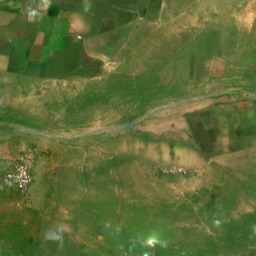
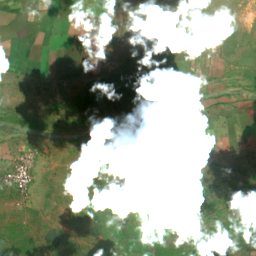 VyomSentinel-2, cloudy
Drag to compare. Error against a clear pass a few days later.
Every image here is a real output on a scene Vyom never trained on, shown beside the clear pass taken a few days later. Nothing is retouched.
Last clear pass carried forward, then Vyom. Measured on – pixels under the cloud mask.
R² 0.45 → 0.74. Vyom was closer on 36 of 47 scenes; on the other 11, carrying the last clear pass forward was closer. Not yet tested in July to September.
Vyom Earth is a globe you fly into. Search a village, tap a field, and every analysis runs on that outline. The console keeps your fields, history, keys and usage in one place.
A 3D globe with satellite imagery, place names and roads. Search by village and district, a coordinate or a map link, and fly straight to the field.
A cloud-free image and NDVI for the date you ask, rebuilt from the last clear pass and the radar change since then.
Tap inside a field and a boundary model reads 0.5 m imagery and returns its edge along the bund. You can edit every corner.
Every Sentinel-2 pass over the field for up to 400 days, with five indices, the spread inside the field, radar, and each season's green-up, peak and senescence.
Each 10 m pixel is placed in one of six rule-defined states, from low canopy water to a canopy drop against its own recent history. A reason to look, not a diagnosis.
Ask how a field behaved and why. It reads that field's stored results, explains the physics behind each index, and keeps to measured numbers.
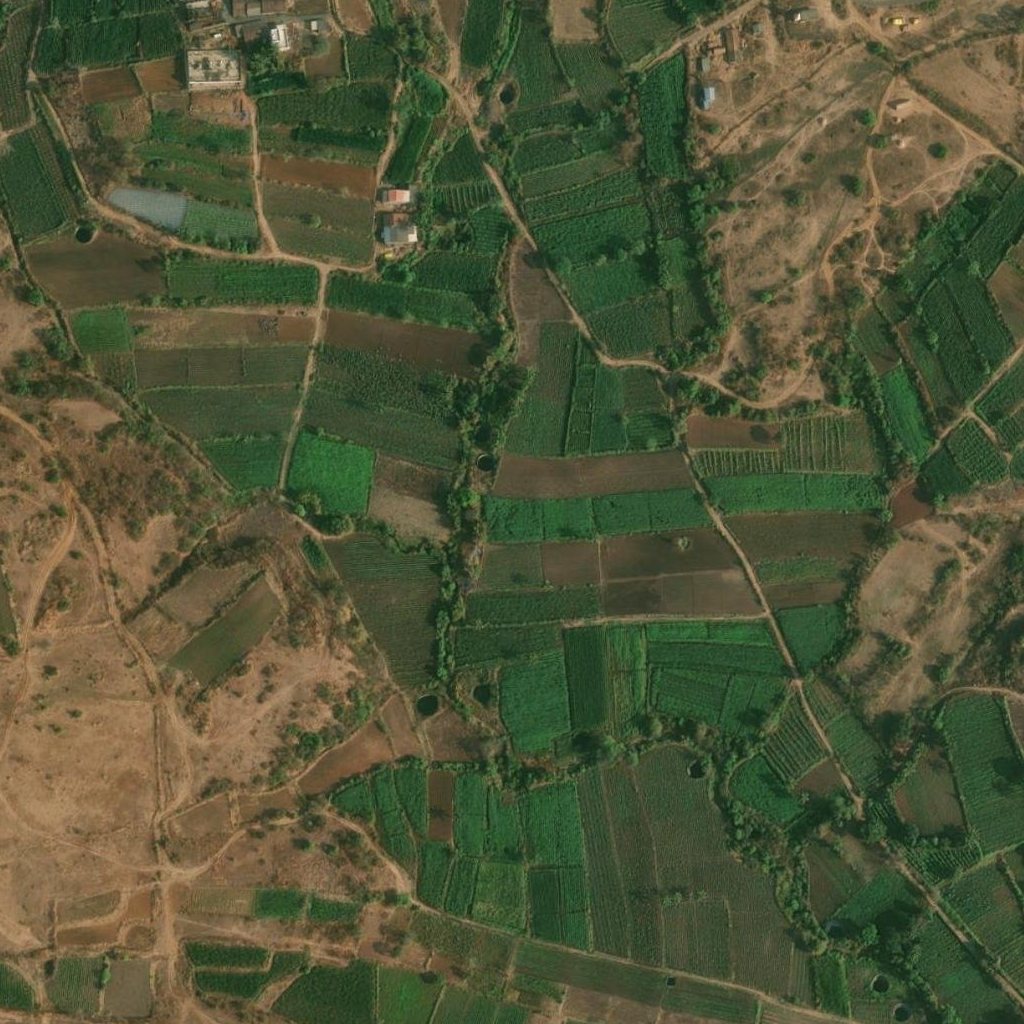
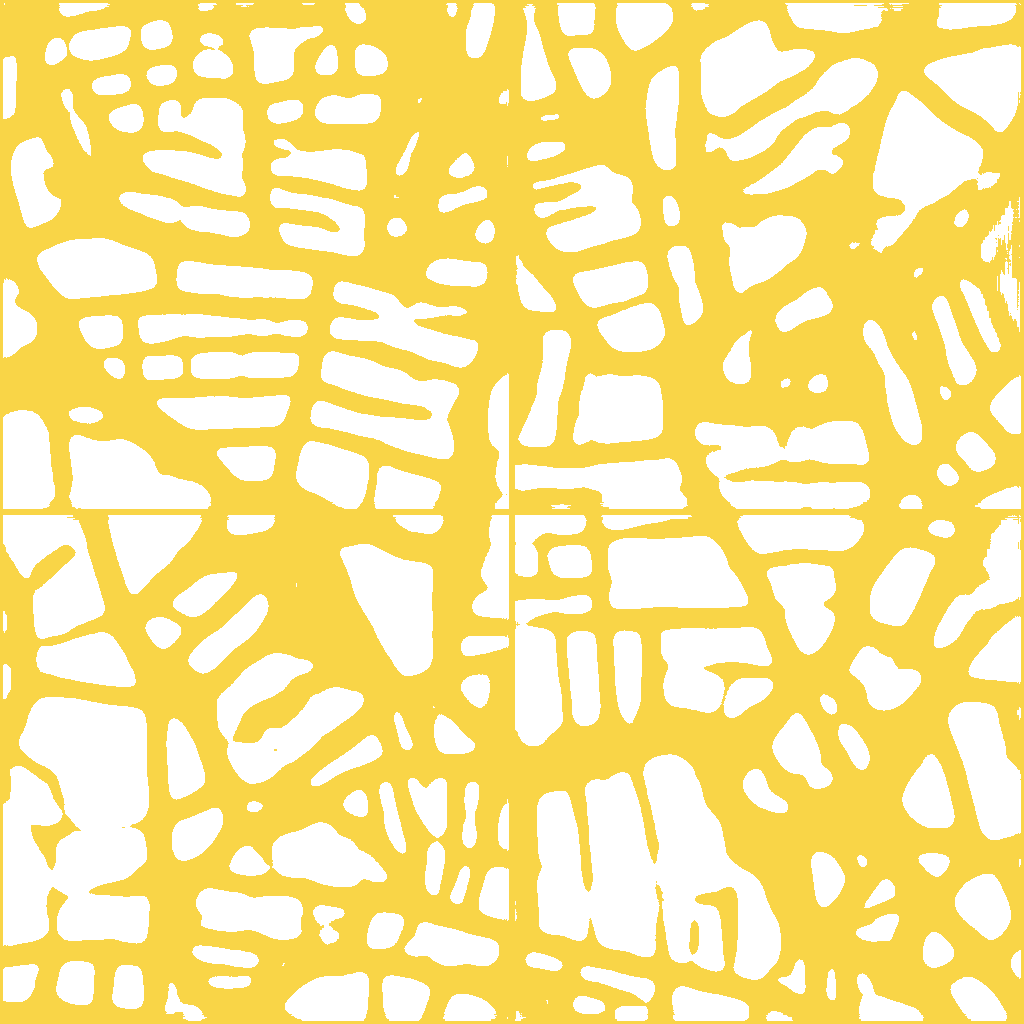 Kolhapur, Maharashtra · held-out test image, boundary model output
Most Indian fields are a few Sentinel-2 pixels wide. Analysing the right outline is the difference between a field's signal and its neighbour's.
A season time series reads every pass over your field and keeps the clear ones. Each value is computed from that pass's own reflectance over the field's 10 m pixels. No model guesses, no crop named.
| Index | Formula (Sentinel-2 bands) | What it responds to |
|---|---|---|
| NDVI | (B8 − B4) / (B8 + B4) | Green canopy cover. Rises at green-up, peaks near flowering, falls at senescence; saturates in dense canopy. |
| NDRE | (B8A − B5) / (B8A + B5) | Chlorophyll in the canopy via the red edge. Keeps responding where NDVI saturates. Related to, but not a measure of, nitrogen. |
| NDMI | (B8 − B11) / (B8 + B11) | Canopy water, from short-wave infrared absorption. Separates a water problem from a canopy problem. |
| EVI | 2.5 (B8 − B4) / (B8 + 6 B4 − 7.5 B2 + 1) | Greenness corrected for soil and haze; saturates later than NDVI. |
| MNDWI | (B3 − B11) / (B3 + B11) | Open water, such as flooded paddy or waterlogging (above 0). |
| VV, VH | Sentinel-1 backscatter, dB | Canopy structure and surface moisture, through cloud and rain. Fills the monsoon weeks optical cannot see. |
For farmers: what to do this week.
For understanding: how fields behave, and why.
Send a GeoJSON polygon and a date. Get cloud-free NDVI, spectral states, map layers, a GeoTIFF and Vyom's 896 features. Season analyses run as jobs you poll.
curl -X POST https://vyom.sphitih.in/api/v1/analyze-parcel \
  -H "X-API-Key: $VYOM_KEY" \
  -H "Content-Type: application/json" \
  -d '{
    "geometry": {"type": "Polygon", "coordinates": [[[76.8161,25.1838],
                 [76.8170,25.1838],[76.8170,25.1846],[76.8161,25.1846],[76.8161,25.1838]]]},
    "date": "2025-10-15",
    "tasks": ["cloud_free_ndvi", "spectral_state_6class", "embeddings"]
  }'
import os, requests

r = requests.post("https://vyom.sphitih.in/api/v1/analyze-parcel",
    headers={"X-API-Key": os.environ["VYOM_KEY"]},
    json={"geometry": field_polygon, "date": "2025-10-15",
          "tasks": ["cloud_free_ndvi", "spectral_state_6class", "embeddings"]})
res = r.json()
print(res["cloud_free_ndvi"]["ndvi_vyom_v3"])          # field-mean NDVI on that date
print(len(res["vyom_embedding_896d"]["mean"]))   # 896 features
import os, time, requests
H = {"X-API-Key": os.environ["VYOM_KEY"]}
API = "https://vyom.sphitih.in/api/v1"

job = requests.post(f"{API}/phenology", headers=H, json={
    "geometry": field_polygon, "start": "2024-11-01", "end": "2025-10-31"}).json()
while (s := requests.get(f"{API}/jobs/{job['job_id']}", headers=H).json())["status"] in ("queued", "running"):
    time.sleep(5)
for season in s["result"]["seasons"]:
    print(season["greenup"], season["peak_date"], season["senescence"])